
About Me
Hi!! I'm Brian Latta, I’m a data analyst with training in data analysis, visualization, and problem-solving. I enjoy turning raw data into clear, useful information and finding patterns that help answer real-world questions.I’m continuing to build my skills through hands-on projects and am excited to begin my career in data analytics.
Skills

Data Cleaning & Validation
Spreadsheet Analysis & Reporting
Statistical Analysis & Regression
SQL & Relational Databases
Dashboard Development & Data Visualization
Data Quality & Database Management
Featured Projects
EXCEL | DATA ANALYSIS
Penguin Size Analysis
Analyzed penguin measurements to identify relationships between physical characteristics using Excel. Applied correlation and regression analysis and visualized the results to uncover patterns in the data.
EXCEL | DATA ANALYSIS | Penguin Size Analysis
Completed as part of my Data Analyst training through NCLab.
Analyzed a dataset of Antarctic penguin measurements using Microsoft Excel. Cleaned and prepared the data, calculated descriptive statistics, evaluated outliers, and used correlation analysis to identify relationships between physical characteristics. After identifying a strong correlation between flipper length and body mass (r = 0.87), I developed a linear regression model and evaluated its performance using residual analysis and RMSE.
Dataset:
The dataset contained physical measurements and characteristics of Antarctic penguins, including species, island, culmen length and depth, flipper length, body mass, and sex. It included both numerical and categorical variables, providing multiple characteristics to explore for patterns and relationships.
Data Exploration:
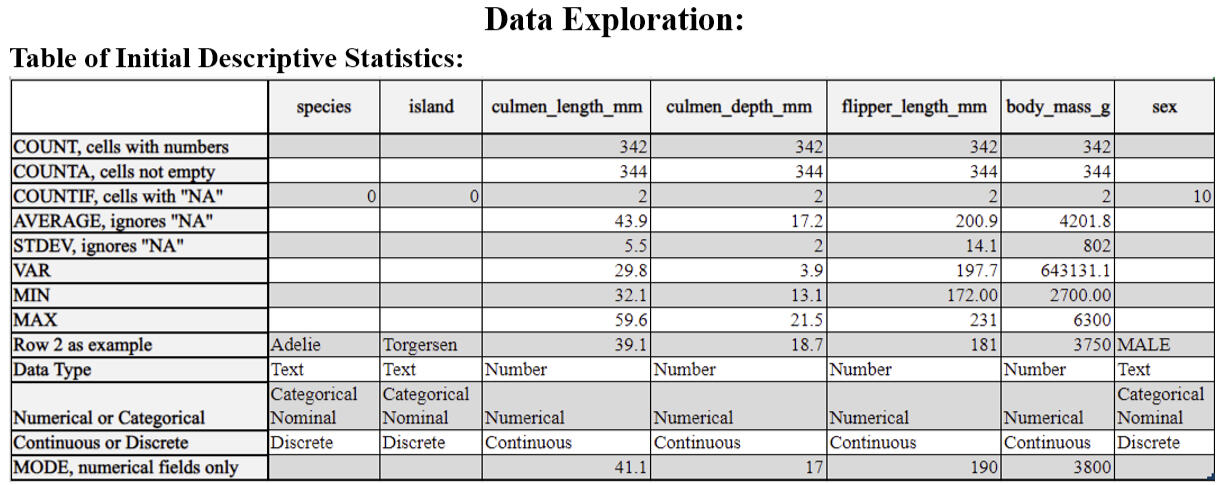
I began by exploring the dataset and calculating descriptive statistics for the measurable variables. This initial review helped me understand the structure of the data, identify missing values that would need to be addressed, and examine the ranges and distributions of the penguins' physical measurements.The exploration also revealed noticeable variation among the penguin species and their physical characteristics, particularly body mass.
Data Cleaning & Preparation
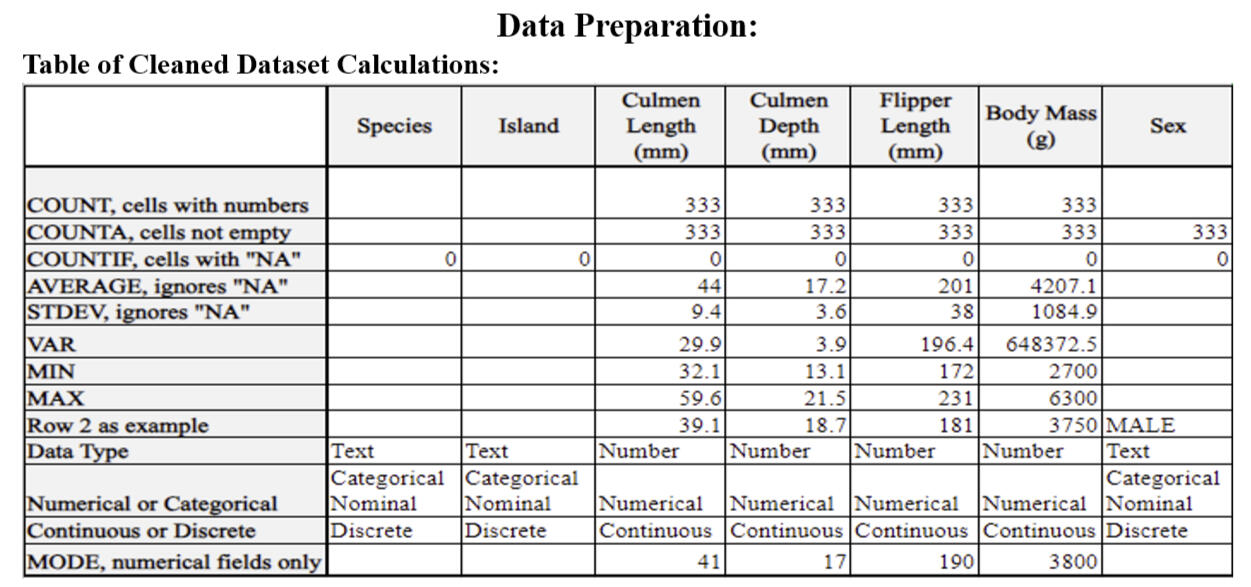
After exploring the original dataset, I cleaned and prepared the data for analysis by removing records containing NULL values, invalid data, redundant data, and other out-of-specification values. I also recoded categorical variables into numerical values so they could be used in formulas and statistical analysis.After cleaning, the dataset contained 333 complete records with no remaining NA values in the analyzed fields.
Preliminary Analysis
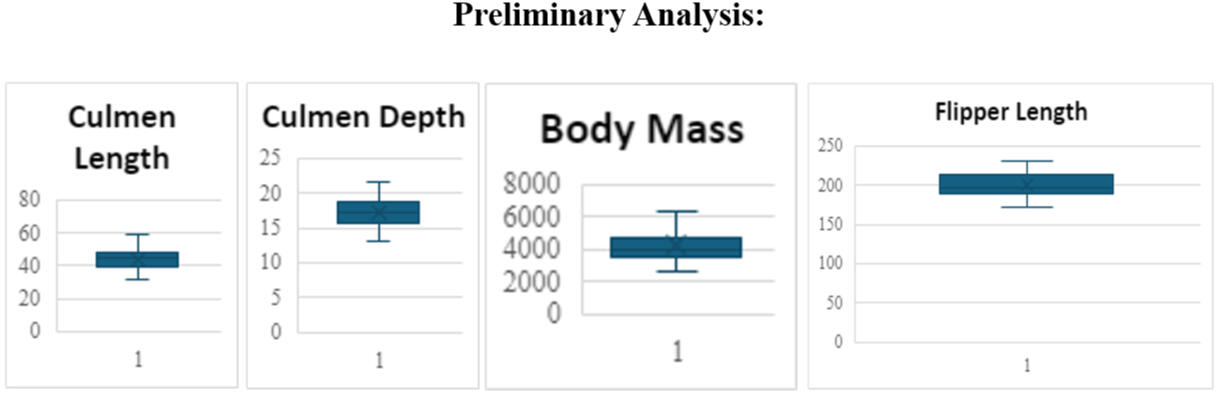
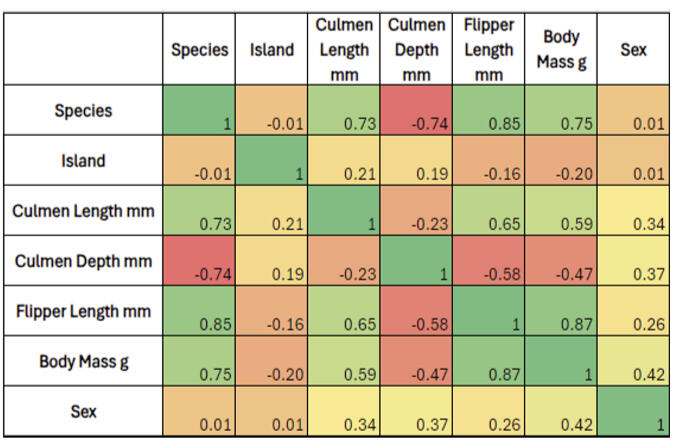
I began by examining the measurable variables for outliers and exploring relationships between the different characteristics. Boxplots showed that the data was largely free of significant outliers. I then created a correlation heatmap to identify which variables had the strongest relationships.
Key Findings:
The strongest relationship was between flipper length and body mass, with a correlation coefficient of 0.87, indicating a very strong positive relationship. Species also showed strong relationships with flipper length (0.85) and body mass (0.75). Culmen length showed moderate relationships with both flipper length (0.65) and body mass (0.59).Based on these results, I selected flipper length and body mass for further analysis using linear regression.
Regression Analysis:
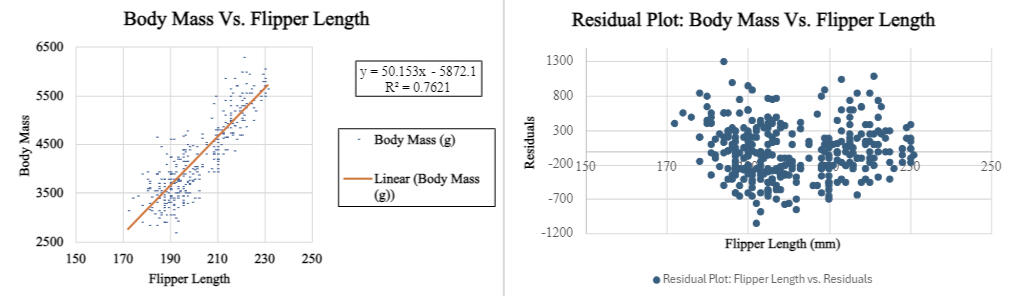
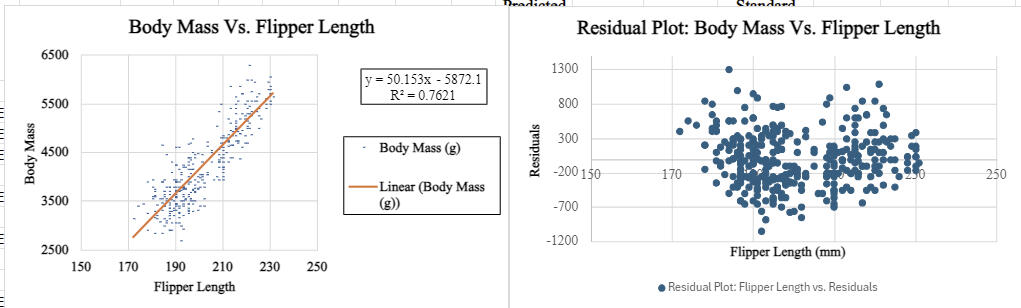
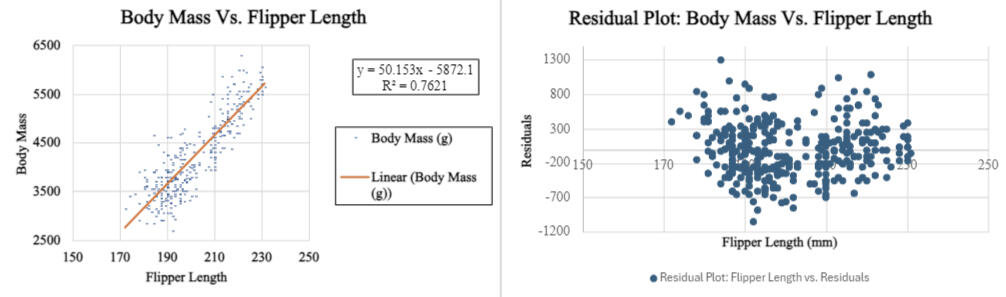
I used linear regression to further analyze the relationship between flipper length and body mass. The scatterplot showed a clear positive linear relationship, confirming that penguins with longer flippers tend to have greater body mass.The regression model produced an R² value of 0.7621, indicating that approximately 76% of the variation in body mass can be explained by flipper length in this model. I also examined the residual plot to evaluate whether linear regression was appropriate. The residuals were generally distributed around zero without a clear pattern, supporting the use of the linear model.
Model Performance:
I calculated an RMSE of 392.16 grams, representing the typical difference between predicted and actual body mass. The result indicated that the observations generally followed the regression trend while still showing some natural variability.
Conclusion:
This analysis identified a strong relationship between flipper length and body mass in Antarctic penguins. Through this project, I applied the complete analytical process—from data exploration and cleaning through correlation analysis, visualization, linear regression, and model evaluation—to turn raw data into clear, measurable insights.The analysis also demonstrated how exploratory findings can guide deeper statistical analysis, ultimately allowing me to develop and evaluate a model for estimating body mass from flipper length.
Nisl blandit